How Can We Help?
Understanding quiz metrics
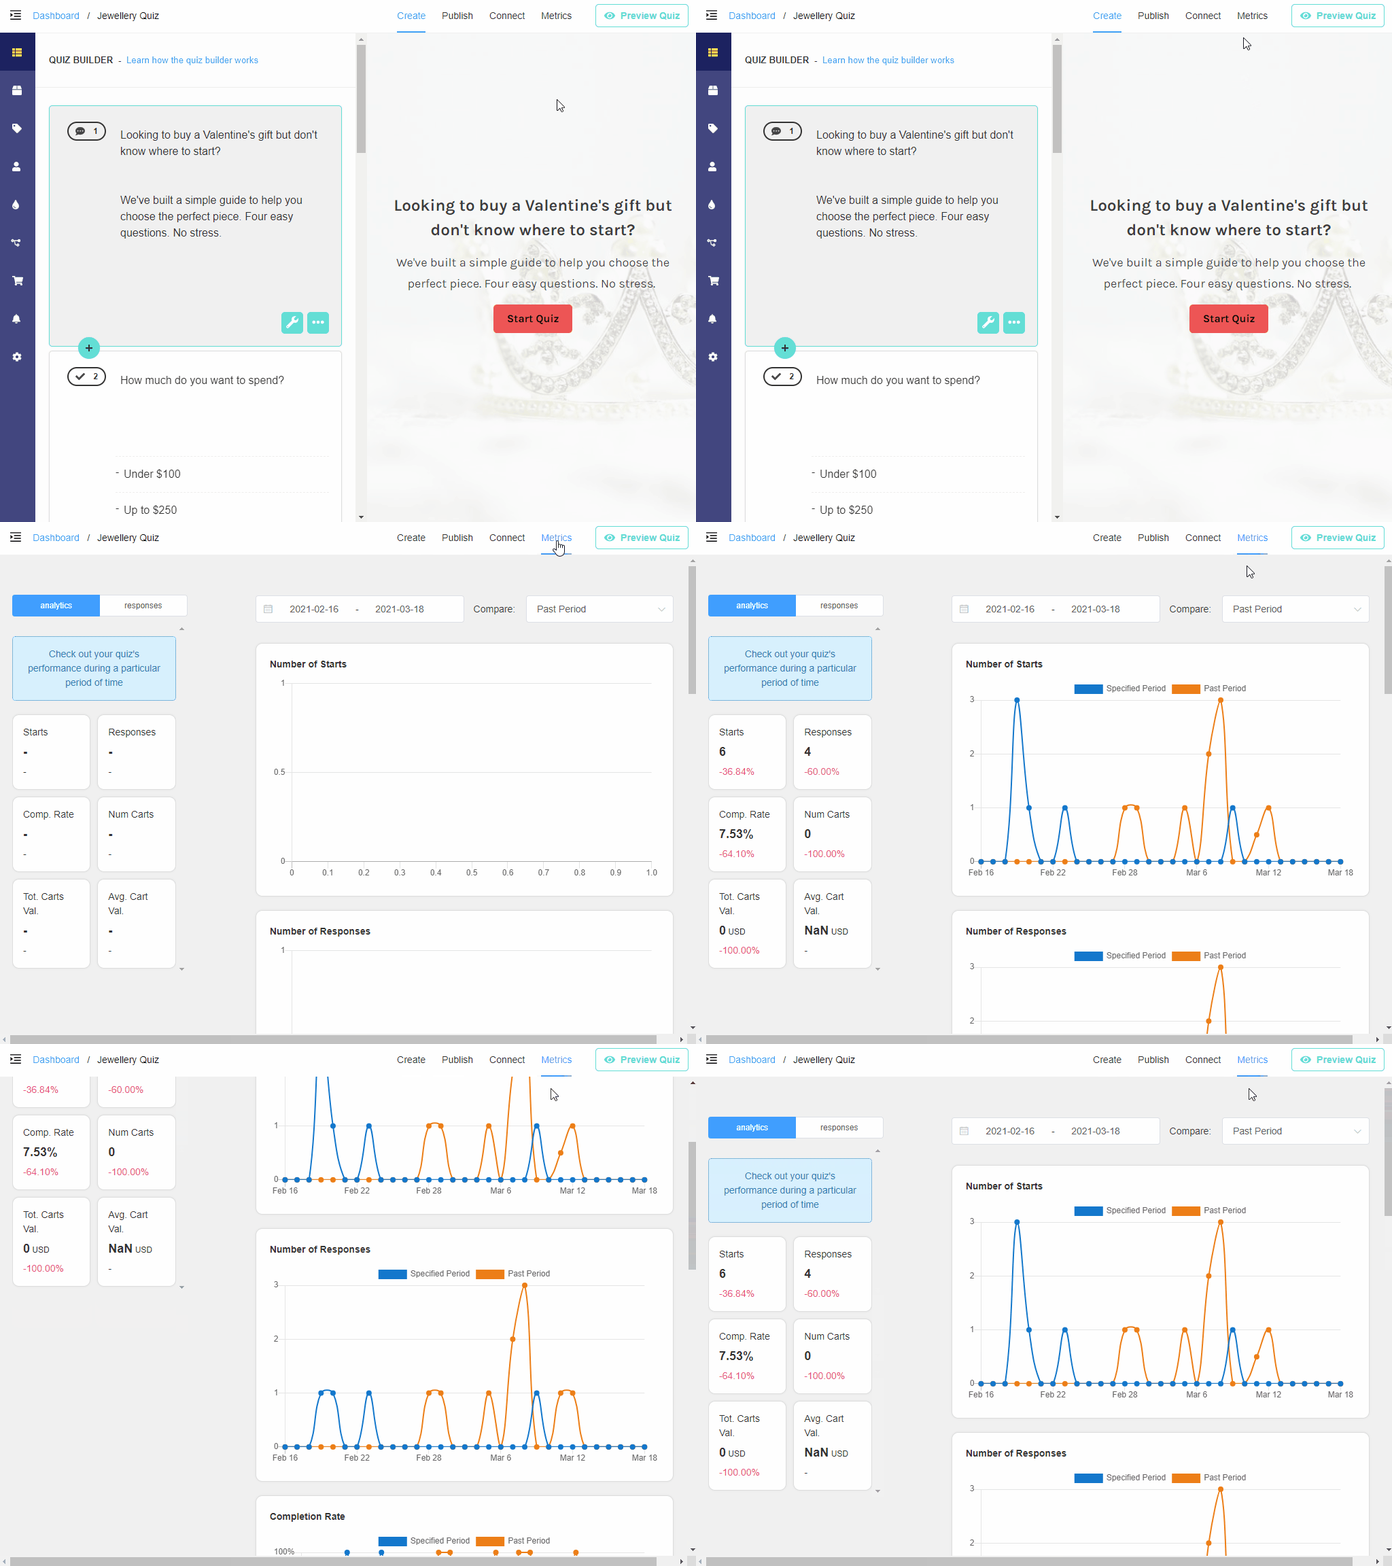
To find the quiz metrics go to Quiz Builder -> Metrics.

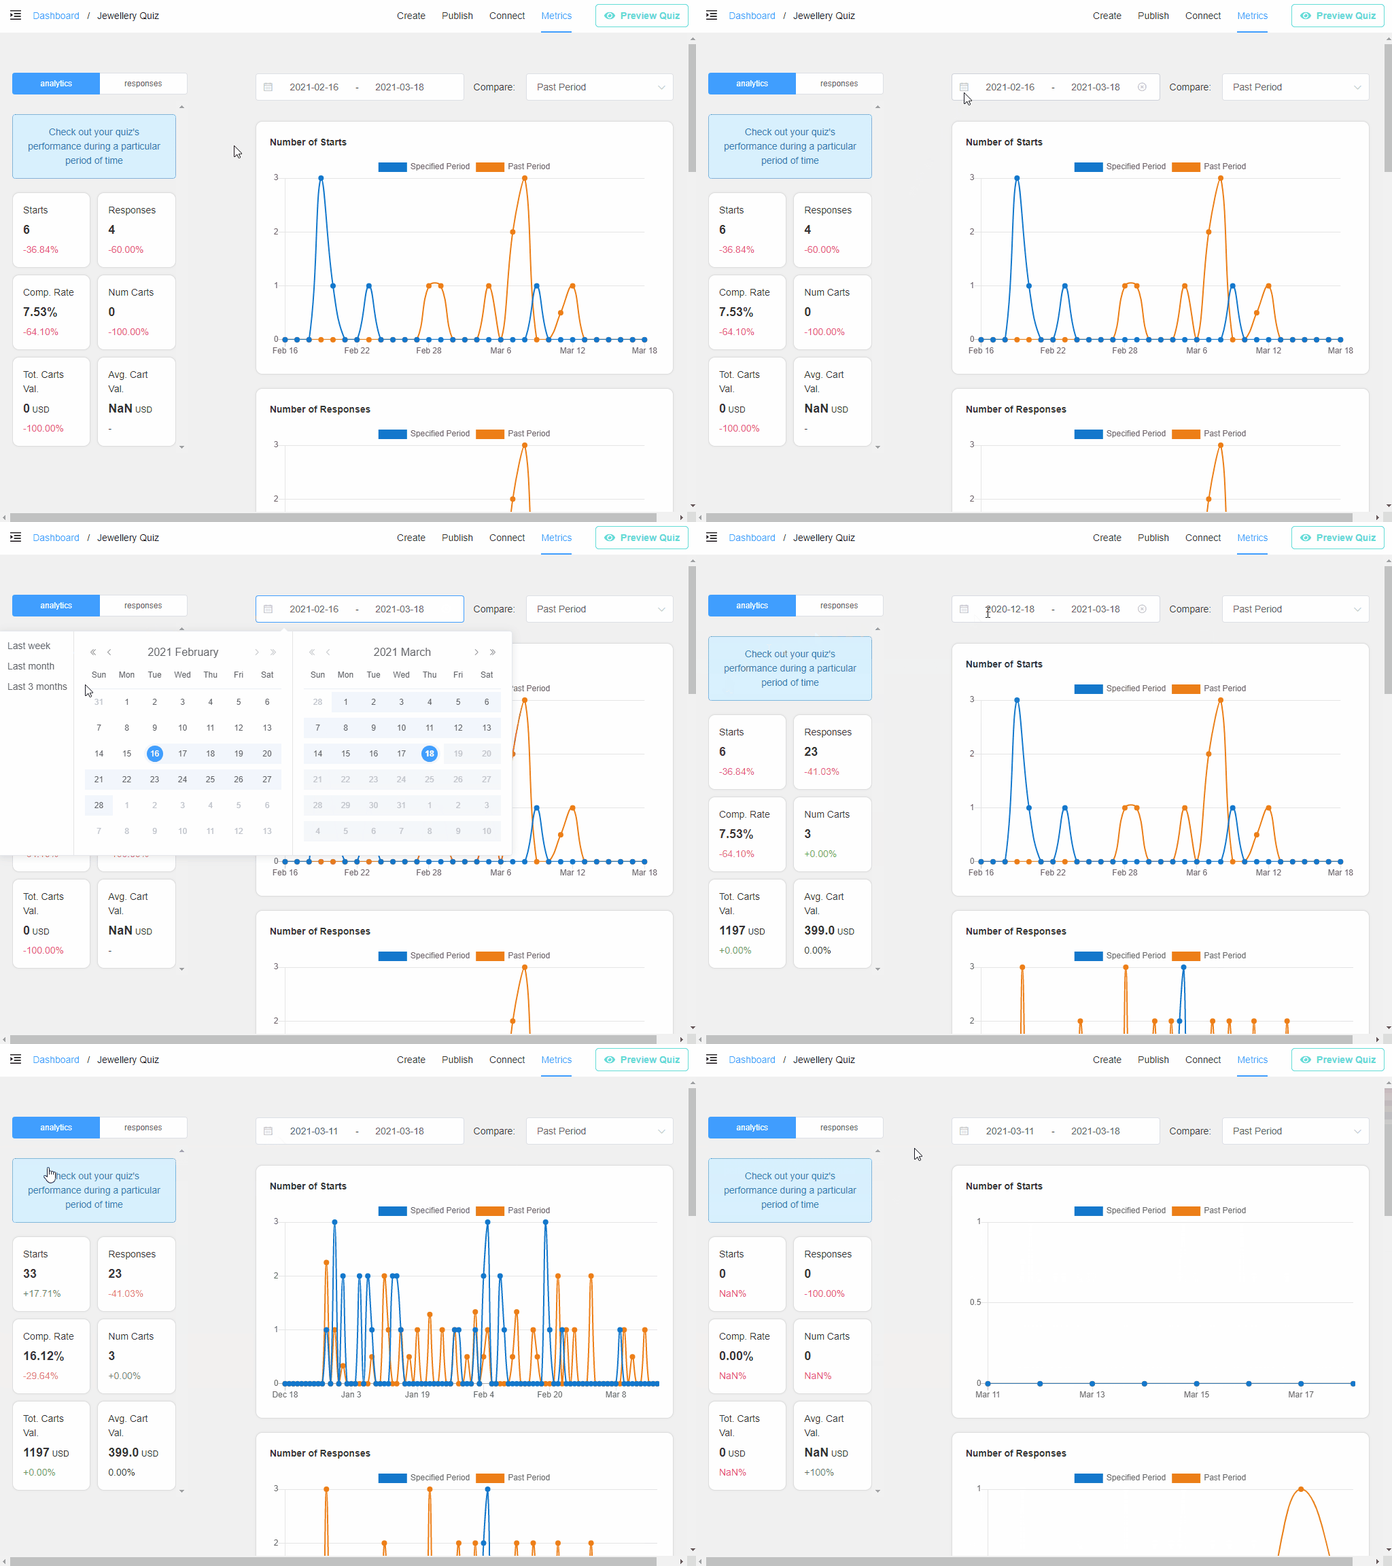
The data in the graphs are totals in a selected period of time for a selected quiz. You can change the period to select it from the moment you started using the quiz or from a given date.

Here’s an explanation of terms used in the Metrics section of the app:
Quiz Starts: number of people who have engaged with the quiz and have passed the first slide (clicked on the “start quiz” button or answered the first question)
Quiz Responses: number of people who have completed the quiz
Completion Rate: percentage of people who have engaged with the quiz and completed it
Carts Count: number of people who have selected products and clicked on the “proceed to cart” or “proceed to checkout” button
Avg. Cart Value: average value of the products included in the carts or checkouts
Total Carts Value: total value of the products included in all the carts or checkouts. This does not represent the total value of purchases since you should expect some drop-off at checkout.